Certain Philadelphia Schools are Beating the Odds for Their Students. Let’s Find Out How and Expand Their Best Practices.

There is quality teaching and learning happening across our schools producing significant academic gains for students. In order to better understand and replicate what is working, Elevate 215 sought to identify the schools making progress for students, and learn about the practices they were deploying to achieve these results.
While an impactful education includes layers of operational intricacies and comprehensive academic strategies unique to each school, examining learning data across schools made sense as a place to start. Elevate 215 analyzed the longitudinal academic data of all K-8 Philadelphia public schools (for whom growth data was available) and compared it to demographically similar schools across the country. The data shows there are Philadelphia schools that delivered exceptional growth for low-income students of color over a ten-year period (2009-2018)—beating the odds for their students.
More specifically, we worked with researchers at Attuned Education Partners and Exponent Education who used school-level demographic data and a statistical method called multivariate ordinary least squares regression (OLS) to predict how a school’s student demographic makeup affects the academic achievement and academic growth of that school. (Learn more about the OLS process.)
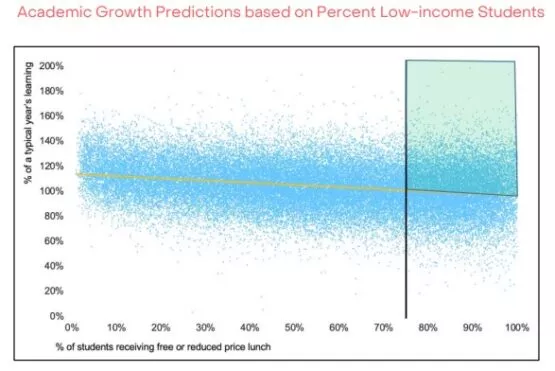
Through this analysis, schools that “Beat the Odds” and outperformed their demographically similar schools emerged. Elevate 215 first looked at Philadelphia schools that showed significant growth over a 10-year period (student learning growth rates over 10% more than predicted), and then filtered for schools that enrolled the highest need populations (>75% low-income [see the chart below], >70%+ Black and Latino/a students).
[In the figure below, academic growth is compared to the percent of students identified as low-income for all schools in the U.S. (blue dots). The horizontal yellow line is the best-fit line or the predicted growth. All schools above that line have higher growth rates than predicted. The top right quadrant shaded in green are examples of U.S. schools, including schools in Philadelphia, with student populations of 75% low-income or more and had actual growth above the predicted line. In this simplified regression model, these schools are considered beating the odds for students.]
We then filter the Philadelphia schools based on whether they ranked in the middle two performance tiers on the School District’s quality rating system (SPR) in the last year for which such data was available. We then determined these schools were in the best position to potentially elevate their student performance.
Using Further Engagement to Help Schools Elevate Their Impact
While this data is a helpful lens to look at schools, we know it does not tell the whole story. An in-depth examination of what is working at these schools requires more than what we can find in the data.
Therefore, in order to determine what can be done to help schools to accelerate their impact, we are now engaging with schools that the data shows are beating the odds for their students directly to better understand what practices have led to student academic growth in the past, and what can be done to expand their impact moving forward.
We will support cohorts of schools each year to learn together, plan, and implement school-specific initiatives to improve student learning outcomes based on research and their analysis of what their students need. In doing so, we hope to take what we learn and explore ways to replicate the most effective practices to schools across the city of Philadelphia.