Apply Philly Charter Data Show Family Demand for Seats Continues to Outpace Supply

By Elana Galli, Apply Philly Charter Manager
Today, Apply Philly Charter is releasing data from the 2023-24 school application cycle that closed on January 23. This Apply Philly Charter application data provides a snapshot of the current family enrollment demand for seats at participating charter schools across the city, and demonstrates a continued upward trend in the number of students and families submitting applications after the pandemic.
2023-24 School Year Data and Process
The Apply Philly Charter application cycle for the 2023-24 school year opened on September 23, 2022 and closed on January 23, 2023. Schools that are required to conduct lotteries ran them on February 8th, and results for pre-deadline applications submitted by January 23rd were released to families on February 10th for lottery and Renaissance charter schools.
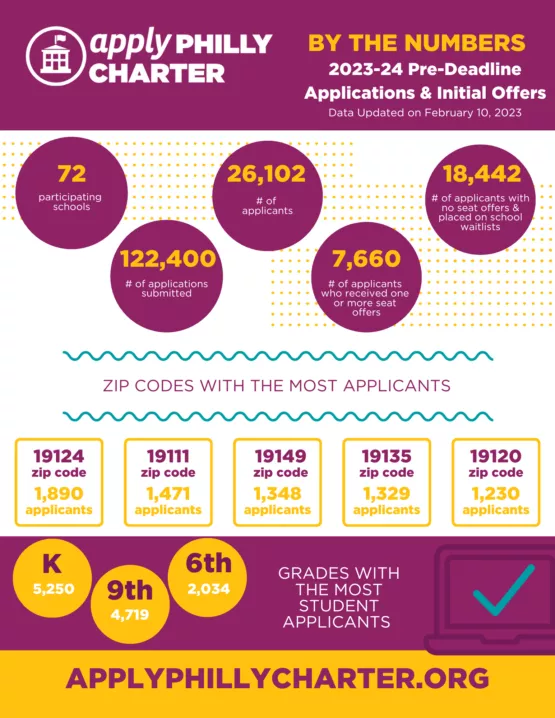
Of the 26,102 students who submitted pre-deadline applications, 7,660 students received one or more seat offers, and 18,442 students received no seat offers and were placed on school waitlists.
Schools are able to make offers off of their waitlists as students decline seat offers and after the February 24th seat acceptance deadline. Beginning on February 13th, students who missed the pre-deadline application window were able to submit a post-deadline application for the 2023-24 school year; however, most post-deadline applications will be waitlisted.
Here is an infographic with the topline data from this application cycle:

Data Trends
This is the fifth application cycle administered by Apply Philly Charter and the second since the 2021-22 school year application cycle that was administered during the pandemic. When examining the five years of data, some interesting trends have been revealed:
After a significant reduction in participation during the pandemic, the number of applicants has been steady over the last two years, although they have not returned to pre-pandemic numbers.
The Number of Pre-Deadline Applicants by School Year Application Cycle
- 2019-20: 29,595
- 2020-21: 34,017
- 2021-22: 23,792
- 2022-23: 26,363
- 2023-24: 26,102
While the overall number of applicants have not reached pre-pandemic levels, the number of applicants this year for the key transition grades of Kindergarten and 9th grade are the second highest on record, exceeding the number of applicants received in either grade for the 2019-20 application cycle.
The Total Number of Applicants by Grade Level by School Year Application Cycle
| Grade | 2019-20 | 2020-21 | 2021-22 | 2022-23 | 2023-24 |
| K | 4973 | 5729 | 4470 | 4487 | 5250 |
| 9 | 4262 | 4809 | 3840 | 3893 | 4719 |
Despite the changes to the total number of applicants each year, the average number of applications per applicant has remained consistent, generally falling between four and five applications per student.
The Average Number of Applications Per Applicant by School Year Application Cycle
- 2019-20: 4.16
- 2020-21: 4.99
- 2021-22: 4.68
- 2022-23: 4.71
- 2023-24: 4.68
In all five years of the Apply Philly Charter platform, the same three zip codes have produced the most applicants.
The Zip Codes with the Most Applicants by School Year Application Cycle
2019-20
- Zip Code: 19124 | Applicants: 1,854
- Zip Code: 19111 | Applicants: 1,599
- Zip Code: 19149 | Applicants: 1,276
2020-21
- Zip Code: 19124 | Applicants: 2,099
- Zip Code: 19149 | Applicants: 1,720
- Zip Code: 19111 | Applicants: 1,699
2021-22
- Zip Code: 19124 | Applicants: 1,388
- Zip Code: 19111 | Applicants: 1,376
- Zip Code: 19149 | Applicants: 1,159
2022-23
- Zip Code: 19124 | Applicants: 1,672
- Zip Code: 19111 | Applicants: 1,362
- Zip Code: 19149 | Applicants: 1,266
2023-24
- Zip Code: 19124 | Applicants: 1,890
- Zip Code: 19111 | Applicants: 1,471
- Zip Code: 19149 | Applicants: 1,348
In the coming months, we plan to dive deeper into the applicant and offer data and we’ll share out any other noteworthy trends in a future Insights post. Stay tuned!